Listening to Your Heartbeat: Using ECG to Understand Emotions, Stress, and Anxiety
Do you remember our conversation last week, where we said emotions are the language of the body? Long before we become consciously aware of feeling anxious, tense, or upset, our bodies have already spoken — through a racing heartbeat, rapid breathing, or sweaty palms. The problem is, we rarely take the time to truly listen.
Among all the organs in the body, the one that is most sensitive and faithful in recording emotional changes is the heart — something we feel every day, yet seldom understand.
Have you noticed how, under pressure, your heartbeat becomes more restless? Or how it slows and feels heavy when you're feeling down? In fact, emotions have long left their mark on your electrocardiogram (ECG).
Today, let’s take a deeper look into how we can use ECG — this window into the mind — to detect emotional states that even we might not yet be aware of, especially stress and anxiety.
Perhaps, the moment we learn to listen to our heartbeat is the moment we begin to master emotional self-regulation.
What is ECG? The Physiology Behind the Electrocardiogram
When we talk about recognizing emotions through heartbeats, we first need to understand: what exactly is an ECG (Electrocardiogram) recording?
ECG: A Tool for Recording the Heart’s Electrical Activity
The heart is not just a muscular pump — it’s also a finely tuned electrical system. Every heartbeat is the result of a precisely coordinated electrical signal within the heart. The ECG is a tool designed to capture and visualize these electrical changes.
At the center of this system is a natural pacemaker — the sinoatrial (SA) node — which rhythmically generates electrical signals. These signals travel from the atria to the ventricles, triggering muscle contractions and pumping blood through the body.
An ECG captures this electrical activity via electrodes placed on the skin, producing waveforms that reflect the heart’s function. By analyzing the shape, rhythm, and timing of these waves, we can assess not only the health of the heart but also gain insights into one’s physical and emotional state.
The Basic Components of an ECG Waveform
A standard ECG waveform includes:
- P wave: Atrial depolarization, signaling the electrical activity before atrial contraction.
- QRS complex: Ventricular depolarization, the main electrical event leading to ventricular contraction — typically the most prominent waveform.
- T wave: Ventricular repolarization, the heart returning to its resting state.
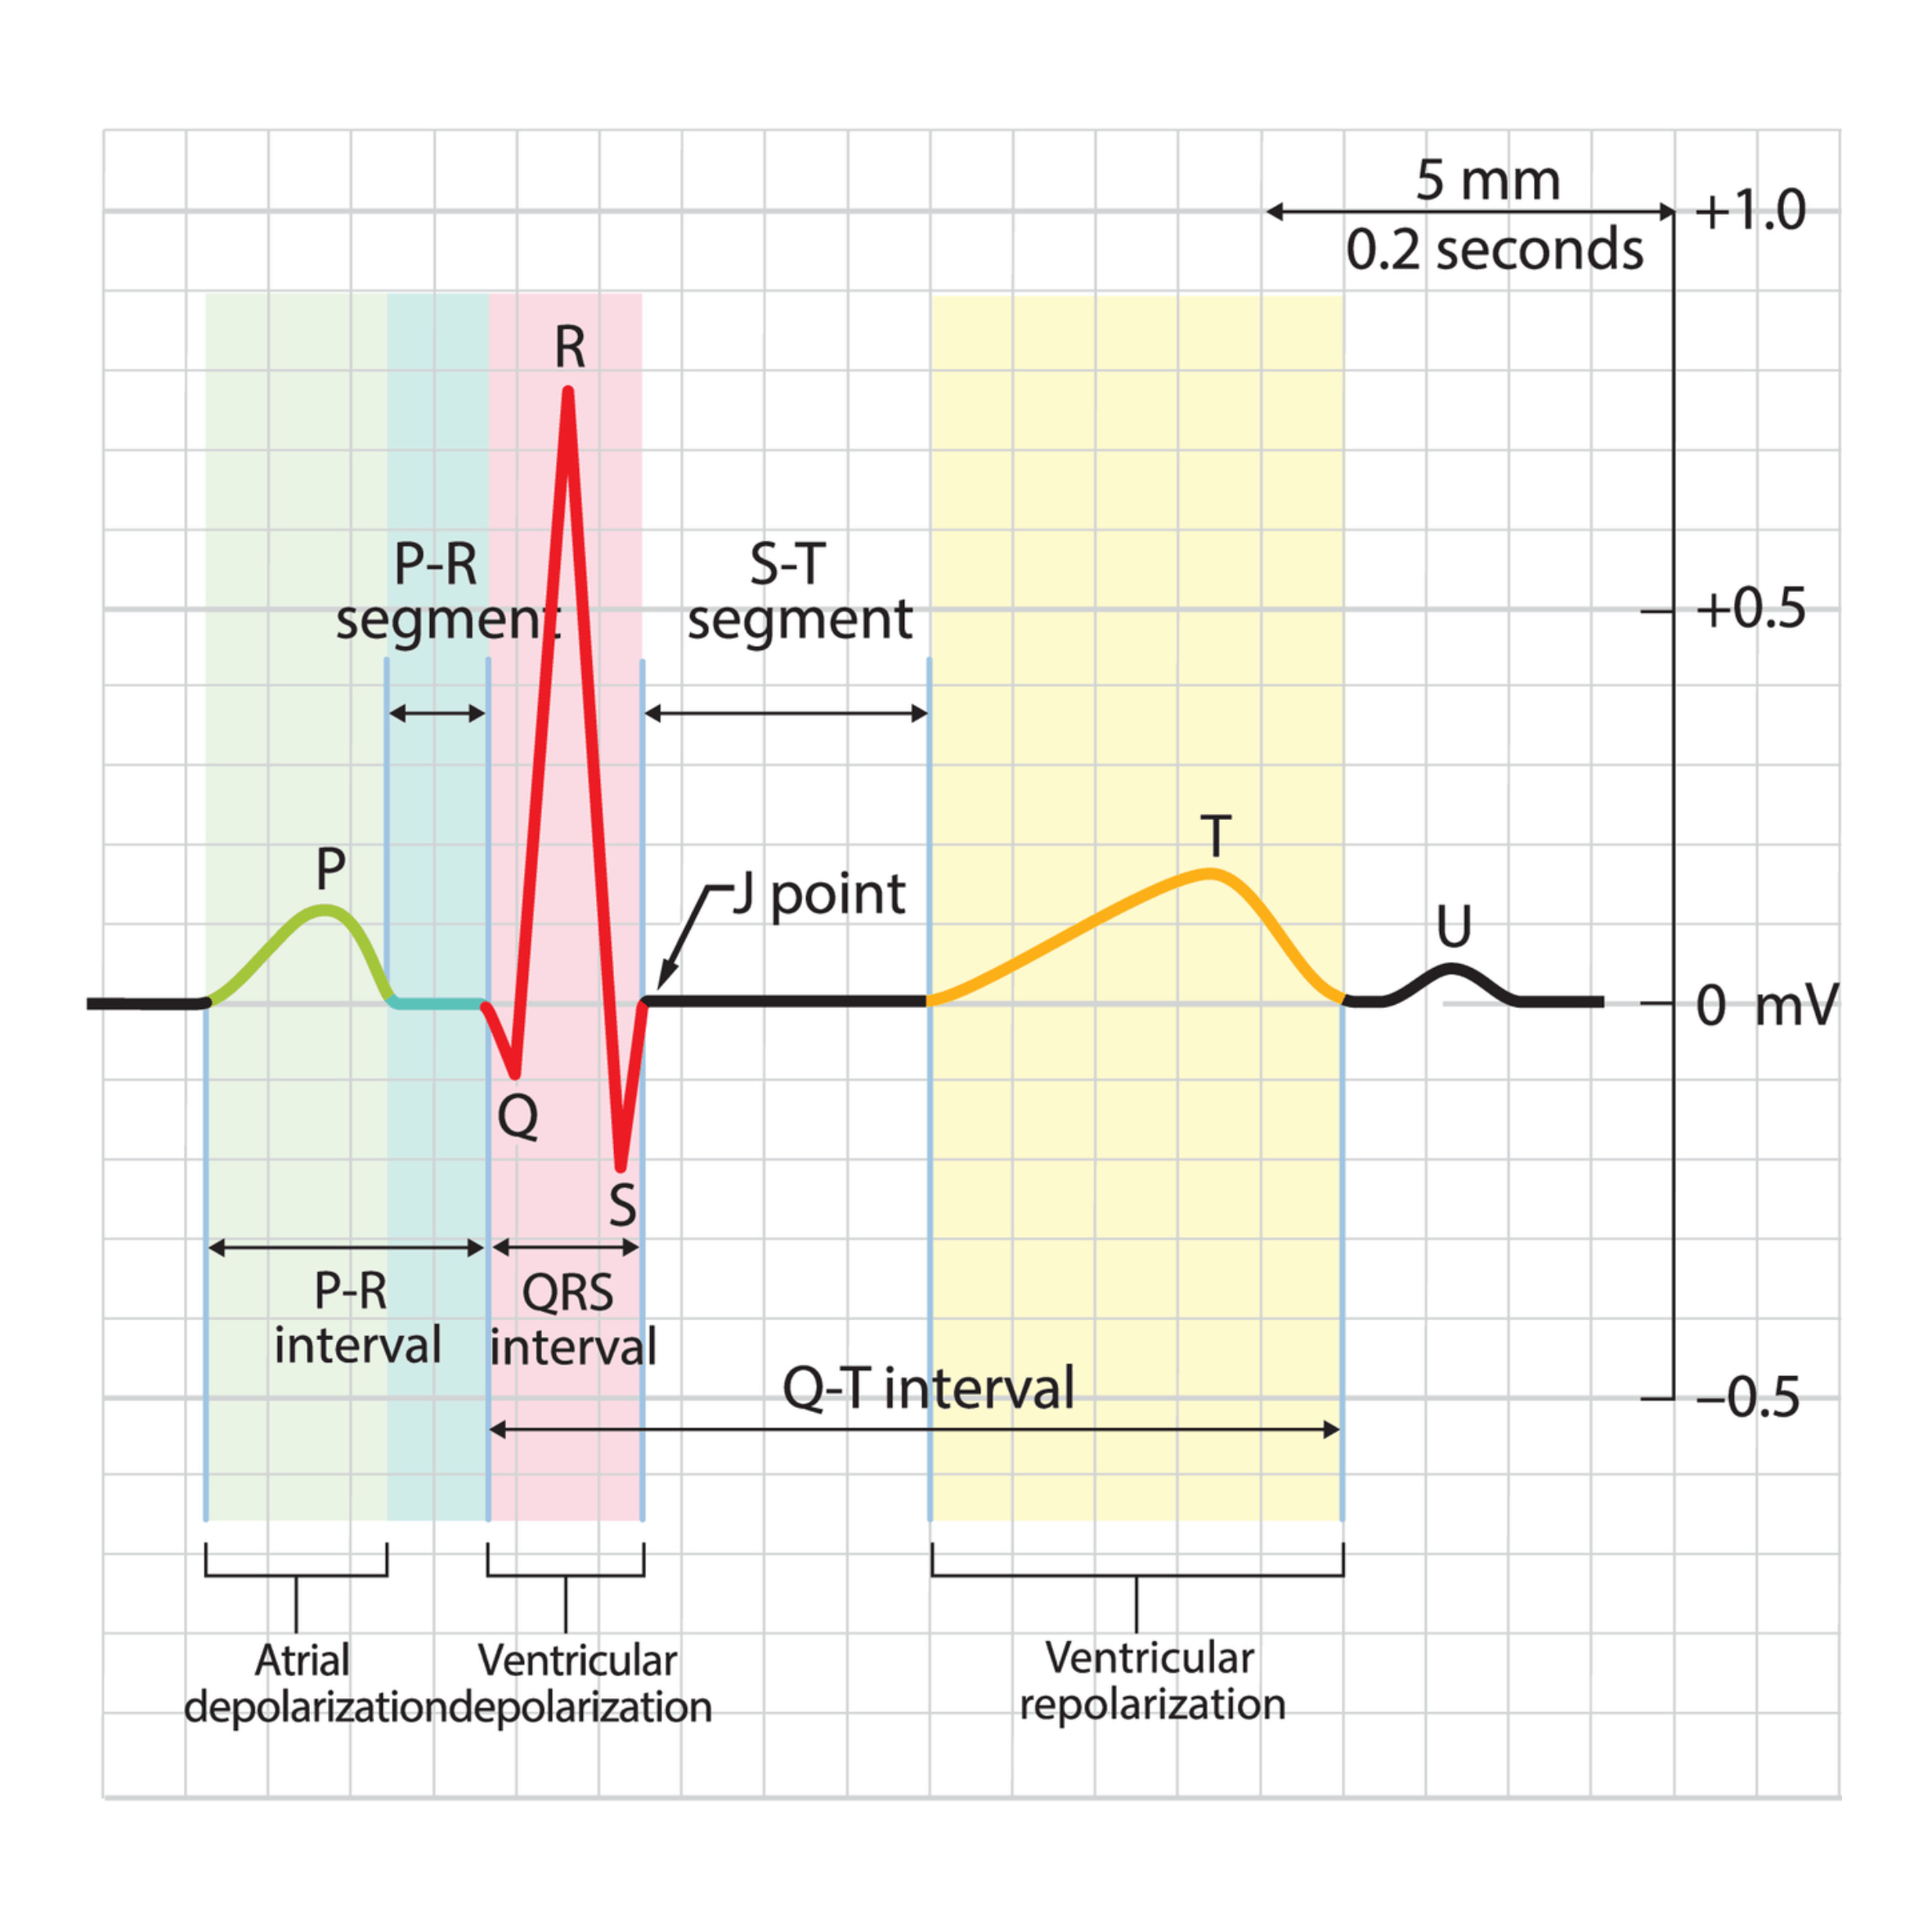
Under normal conditions, these waveforms follow predictable patterns. Deviations may suggest physiological abnormalities — or emotional shifts.
The Autonomic Nervous System: The Invisible Hand Behind the Heartbeat
Although the heart can beat on its own, its rhythm is closely regulated by the brain, through the autonomic nervous system (ANS), which has two main branches:
- Sympathetic Nervous System (SNS)
- Activated in states of stress, anxiety, or excitement
- Increases heart rate and cardiac output
- Think: "fight or flight" mode
- Parasympathetic Nervous System (PNS)
- Active during rest, relaxation, and recovery
- Slows the heart rate and conserves energy
- Think: "rest and digest" mode
These two systems work like a seesaw, dynamically balancing the heart’s rhythm. Emotions are direct feedback from this system at work.
How Are Emotions Reflected in an ECG?
The brain-heart axis has become a focal point in neuroscience and psychophysiology. Emotional changes significantly influence the ANS, and these changes are mirrored in ECG readings:
- Tension and anxiety → Sympathetic dominance → Faster, irregular heartbeats
- Calm and relaxation → Parasympathetic dominance → Slower, steadier heart rhythms
Especially when examining heart rate variability (HRV) — the subtle beat-to-beat fluctuations in heart rate — we uncover deeper insights into an individual’s emotional regulation capacity. We'll explore HRV in more detail shortly.
HRV: A Health Check for Your Emotional Regulation Capacity
If an ECG is like a picture of your heartbeat, then HRV (Heart Rate Variability) is the subtle detail in that picture that reveals the emotional truth beneath the surface.
Unlike heart rate, which tells you how many times your heart beats per minute, HRV asks: Are the intervals between each beat naturally varying?
What is HRV?
HRV refers to the tiny fluctuations in the time interval between consecutive heartbeats — technically known as the R-R intervals.
Even when we're at rest, our heart doesn't beat like a metronome at a perfect 70 bpm. Instead, it subtly speeds up and slows down: one beat might come 920 ms after the last, the next at 890 ms.
This seemingly minor inconsistency reflects the body’s adaptability and the nervous system's flexibility in adjusting to both internal and external environments.
From a neuroregulatory perspective, HRV represents the interplay between the sympathetic (accelerator) and parasympathetic (brake) nervous systems — much like how a skilled driver modulates speed smoothly with both pedals.
HRV as a Window into Emotional Regulation
Higher HRV indicates stronger adaptability in heart rate regulation and a more flexible autonomic nervous system. In emotional terms, this means:
- Better recovery from stress
- Greater emotional stability and resilience
In contrast, reduced HRV is often linked to:
- Chronic stress
- Anxiety disorders
- Depressive states
- Emotional exhaustion and burnout
Studies show that individuals under prolonged stress — such as caregivers, overworked professionals, or insomnia sufferers — tend to have significantly lower HRV than healthy individuals.
Common HRV Metrics Explained
HRV isn't a single number but a group of complex indicators derived from ECG signals. They’re commonly divided into:
Time-Domain Measures
- SDNN (Standard Deviation of NN intervals): Reflects overall variability
- RMSSD (Root Mean Square of Successive Differences): Reflects short-term parasympathetic activity; commonly used in short recordings
- pNN50 (% of successive intervals differing by more than 50ms): Higher values indicate stronger vagal tone (parasympathetic activation)
Frequency-Domain Measures
By applying Fourier Transform to heart rate signals, we get:
- LF (Low Frequency, 0.04–0.15Hz): Reflects both sympathetic and parasympathetic influences
- HF (High Frequency, 0.15–0.4Hz): Primarily represents parasympathetic activity
- LF/HF Ratio: Indicates balance between sympathetic and parasympathetic activity; elevated ratios often signal stress dominance
Why HRV Is Called the “Health Check” of Emotions
HRV is increasingly recognized as an objective biomarker of emotional states. Here's why it's seen as a vital indicator — both in research and real-world applications:
Objectivity: Unlike self-reported emotions from surveys or interviews, HRV is a physiological signal. It can be measured in real-time with devices like ECG, offering emotion insights without relying on subjective expression — particularly useful for children, elderly individuals, or people with communication difficulties.
Sensitivity: Studies show that HRV changes (especially in RMSSD and HF components) often occur before an individual becomes consciously aware of emotional shifts. This makes HRV a valuable early warning sign for emotional dysregulation.
Trackability: HRV can be continuously monitored and quantified. It’s widely used as a feedback tool to assess the impact of interventions like meditation, exercise, mindfulness therapy, music therapy, or sleep management — offering evidence of progress and effectiveness.
Integration with AI: When combined with machine learning, HRV data can help build personalized emotional detection models. These models can track mood changes in real time via wearables, and lay the groundwork for emotion-regulation tools powered by AI — making emotion intelligence more accessible and actionable.
Identifying Anxiety and Stress: What ECG Can Reveal
By now, we know that emotions manifest in the rhythm of the heart through HRV. Among all emotional states, anxiety and stress are two of the most common negative experiences — and their physiological signatures have been well studied. With the help of ECG, these states can be detected with a high degree of accuracy.
In this section, we’ll explore the physiological and signal-based “fingerprints” of anxiety and stress through both data and mechanisms.
Typical ECG Patterns in Anxiety
Anxiety is a state of ongoing psychological vigilance in response to perceived threats. During anxiety, the sympathetic nervous system becomes overactive, while the parasympathetic system is suppressed. In the ECG, this often results in:
Elevated Heart Rate
When anxiety kicks in, sympathetic activity increases, leading to a faster heart rate. This is reflected by shortened R-R intervals. While a normal resting heart rate ranges between 60–100 bpm, anxious individuals often experience rates above 100 bpm — a condition known as tachycardia.
This is a natural "fight or flight" response — your body preparing to respond to stress or danger.
Decreased HRV
Even if you don’t feel the anxiety yet, your body may already be sending subtle distress signals. HRV is one of the most reliable ways to detect this.
You can think of HRV as your body's ability to fine-tune itself. The higher your HRV, the more agile your nervous system — like a skilled driver who can smoothly shift between acceleration and braking. Low HRV, on the other hand, means that your “driver” is becoming sluggish, and your body is stuck in high-alert mode, unable to switch gears.
In anxiety states, several HRV metrics shift noticeably:
Reduced RMSSD and HF Power: These indicate reduced parasympathetic (rest-and-digest) activity. The part of your nervous system that helps you slow down is being suppressed — your body is stuck in overdrive.
Lower SDNN: Reflects diminished overall adaptability in heart rhythm. It’s like a band losing its conductor — the rhythm becomes less responsive to internal or external changes.
Increased LF/HF Ratio: This ratio reflects the balance between sympathetic and parasympathetic activity. When it’s elevated, the sympathetic side dominates, pushing the system toward prolonged stress. This imbalance often correlates with symptoms like irritability, racing thoughts, difficulty concentrating, or restlessness.
Interestingly, this state isn’t always accompanied by a pounding heart or visible distress. It’s often a quiet chaos — the body is tense, but the mind may not fully register the tension. You might look fine on the outside, but your body is whispering, “I’m struggling.”
Many people say “I don’t know what’s wrong with me” when they're overwhelmed by stress or emotion. But in reality, HRV already holds the answer. Anxiety isn’t just a feeling — it’s a full-body physiological state. And HRV is the key to decoding it.
ECG Patterns in Stress States
Though anxiety and stress often overlap, they manifest differently in the body. Acute stress (e.g., sudden shocks) and chronic stress (e.g., long-term overwork) also show distinct ECG patterns.
Acute Stress Response
- Rapid heart rate increase
- Shortened QRS complex intervals
- Sudden drop in HRV, especially in HF power
- Faster breathing, reducing respiratory sinus arrhythmia (RSA) — the natural rhythm fluctuation tied to breathing
Chronic Stress
- Sustained reduction in overall HRV (both SDNN and RMSSD)
- Possible QT interval prolongation — suggesting abnormal heart repolarization (some link this to chronic cortisol elevation)
- Slightly elevated but stable heart rate — the pattern of “low variability under high tension”
While these patterns may not appear in every individual, combining them with HRV analysis significantly improves the accuracy of stress and anxiety detection.
We often say we’re “under pressure,” our “heart is racing,” or we “can’t catch our breath” — these aren’t just metaphors. They reflect real, measurable electrophysiological changes in the body. Thanks to ECG — a non-invasive, portable, and standardized signal recording method — we now have a scientific window into these unspoken emotional states and physiological cries for help.
By listening to your heartbeat, you begin to understand yourself
Beyond observational correlations, a growing body of studies has begun to explore whether these ECG-derived HRV features can be used to directly infer or classify emotional states. These investigations mostly rely on machine learning models, particularly classification algorithms, to analyze HRV features and associate them with different emotional categories.
For example, some studies have found that using HRV features alone—such as time-domain indices like RMSSD and SDNN, frequency-domain indices like LF, HF, and the LF/HF ratio—can achieve relatively high classification accuracy for distinguishing between emotional states such as calmness, stress, anxiety, or sadness. In certain experimental settings, models trained on ECG signals from a single lead were able to distinguish between high-arousal and low-arousal emotional states with accuracies exceeding 80%.
These findings suggest that the heart does more than just passively reflect our emotions—it may also serve as a reliable emotional signature. Through machine learning techniques, these subtle cardiac signals can be decoded into valuable emotional information. This paves the way for a new form of affective computing that doesn't rely on facial expressions, voice, or language but instead taps into the internal rhythms of the body.